20 July 2009

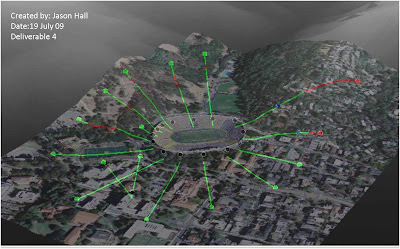
3D view of line of sight analysis


This a 3D view of the orthoimagery and line of sight lines overlaid on a DEM for 3D visualization. I have created line of sight lines within ArcScene but I never knew that you could copy them in ArcMap and paste them into the scene. The only thing I still don't quite understand is when I overlaid the imagery on the DEM the instructions said to offset the base heights by 30. I need to research what this number means and how it affects the display.

Line of sight analysis surrounding Memorial Stadium


This is a line of sight analysis surrounding Memorial Stadium. Also, included below the image is a viewshed based on an observation point from a tower height of around 30ft. I learned that you could create a new field and set your observation points using the OFFSETA field to a certain height.

13 July 2009

Bay area with hydrography and places

A second map showing hydrography and places layers. You can see why DHS requires these layers for threat analysis. With the population in the bay area along with the majority of schools, churchs, businesses, parks, marinas, etc... these layers would be required to know their location if a threat hit and resources were needed.

Department of Homeland Security(DHS) Bay Area Urban Area

This is an overview map of the Bay area showing counties, and places with a 10 mile buffer for analysis purposes.

08 July 2009

Houston crime in vicinity to police stations

This map shows a buffered distance around police stations of 2, 4, and 6 miles. It also shows how much crime is associated within police station zones. Lastly, there are recommended areas for new police substations.

Crime in Houston, Texas

This is a basemap of the Houston area showing crimes. This map was easy to create but the roads layer took forever to draw. Also, I struggled with the chart layout. I had problems getting the chart title to show in the center, and the legend is hard to adjust.